Locations
- 30 May 2025
- 1 Minute to read
- Contributors


- Print
- DarkLight
- PDF
Locations
- Updated on 30 May 2025
- 1 Minute to read
- Contributors
- Print
- DarkLight
- PDF
Article summary
Did you find this summary helpful?
Thank you for your feedback!
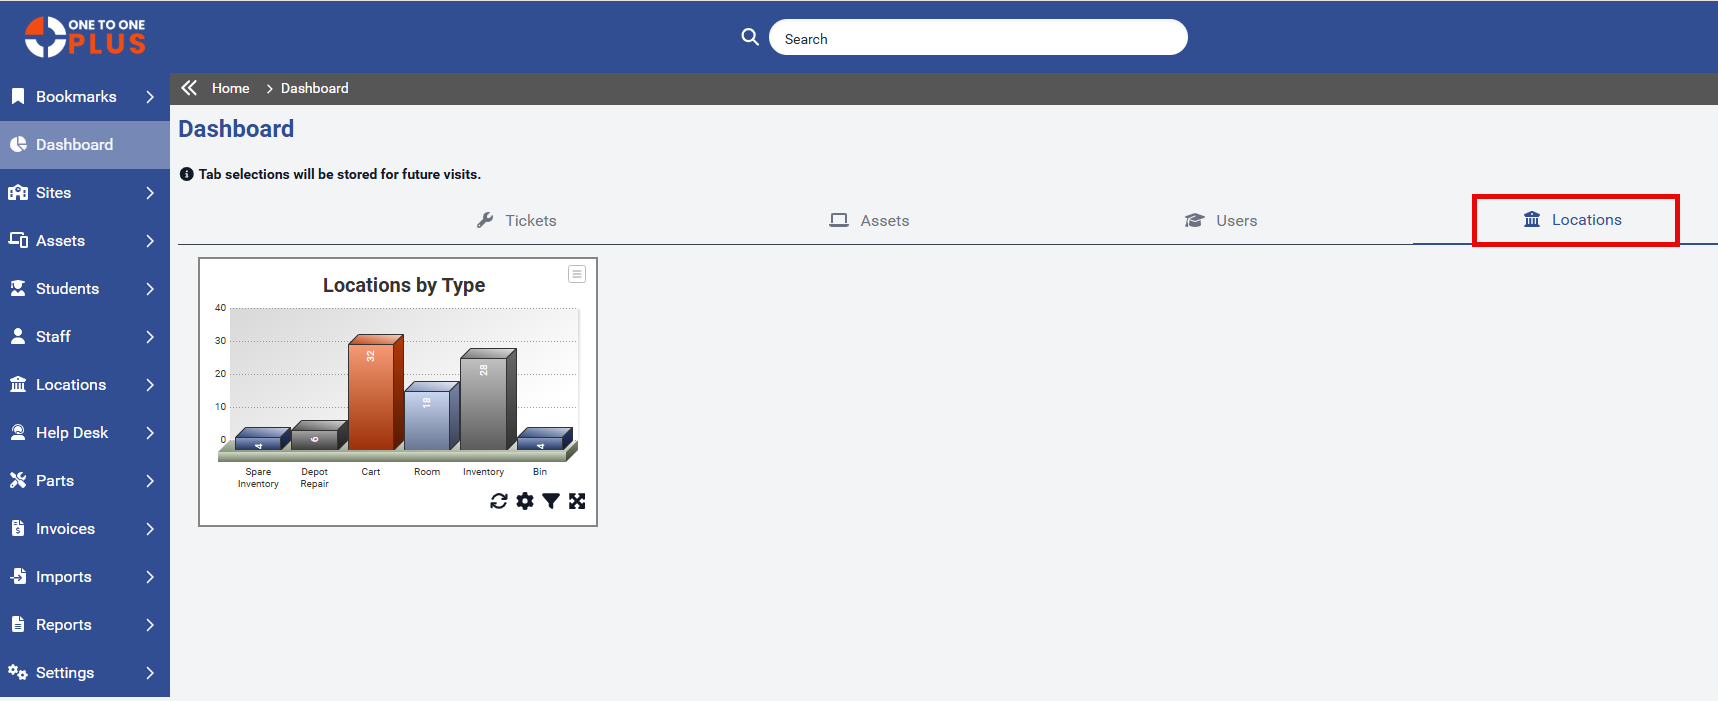
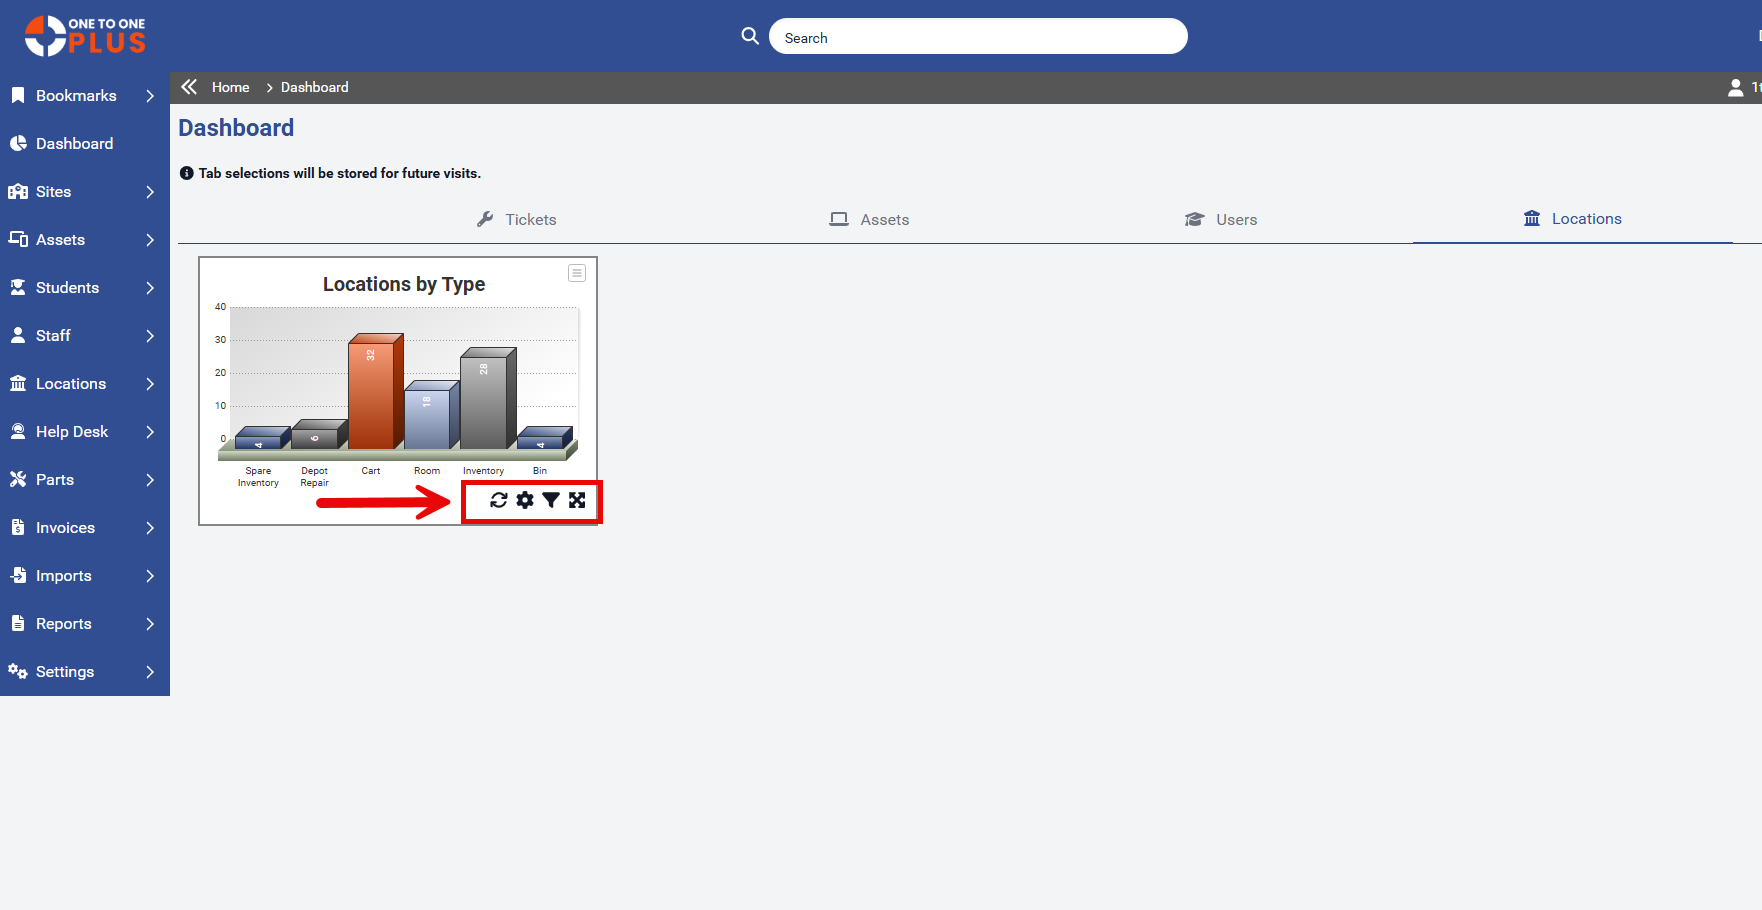
The Locations tab, located under the Dashboard, provides an overview of user data with the ability to drill down into specific details. Each chart displays the number of tickets assigned to a particular location. Clicking on a section of a chart reveals a list of tickets matching the selected filter. The system also remembers your navigation, returning you to the last tab you visited.
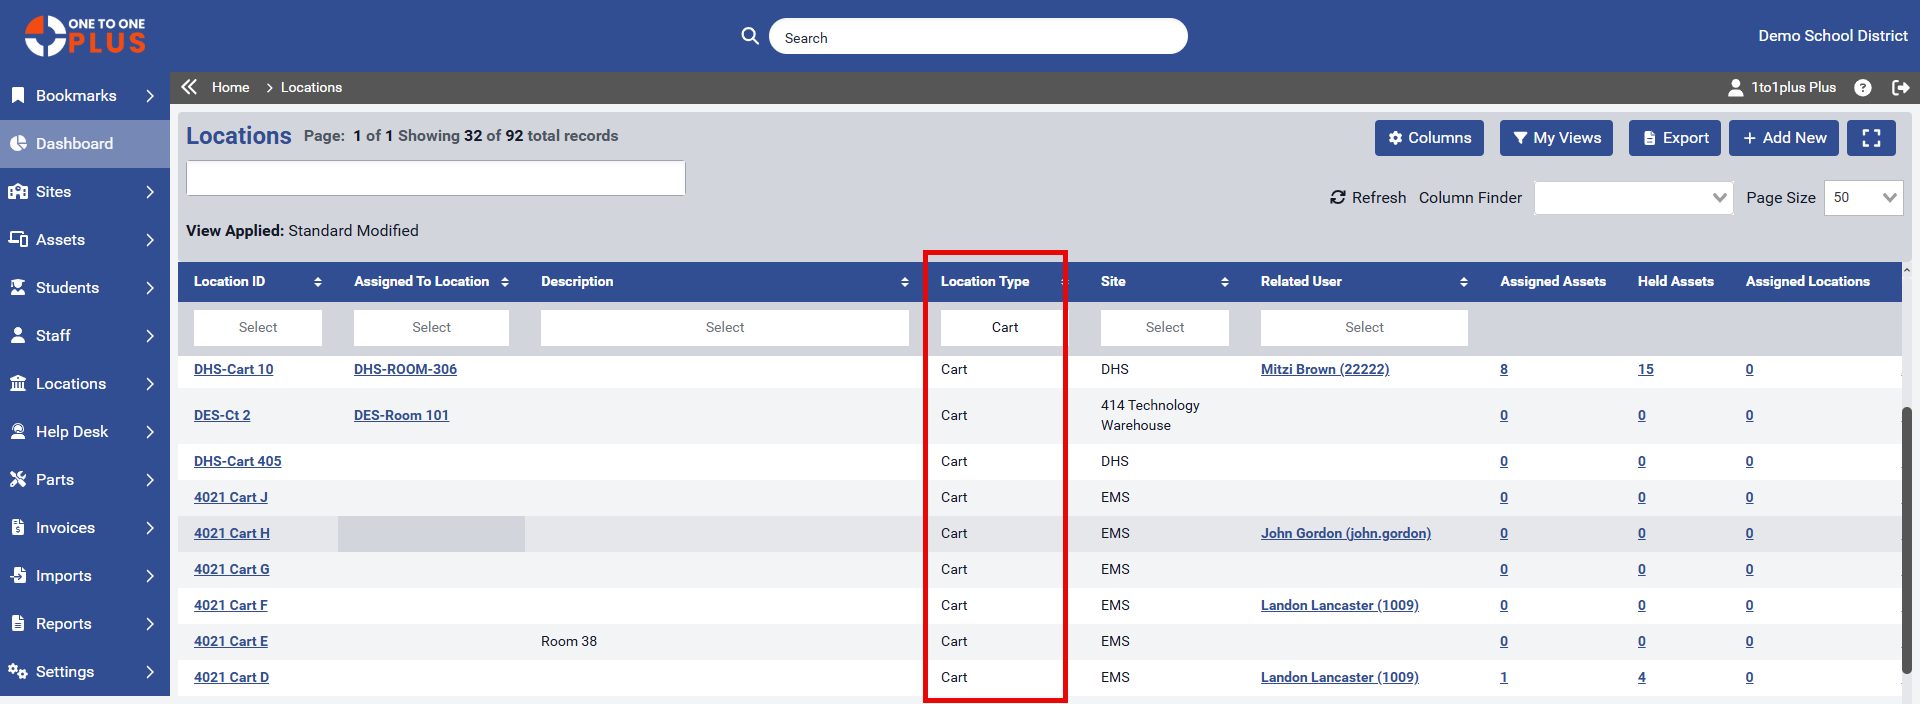
Clicking on a chart section drills down to a list of location type that match the selected filter. In this example, we’ve drilled down to on one location type, Cart.
To display a column header, click the Columns button above the table and check the box next to the desired filter name.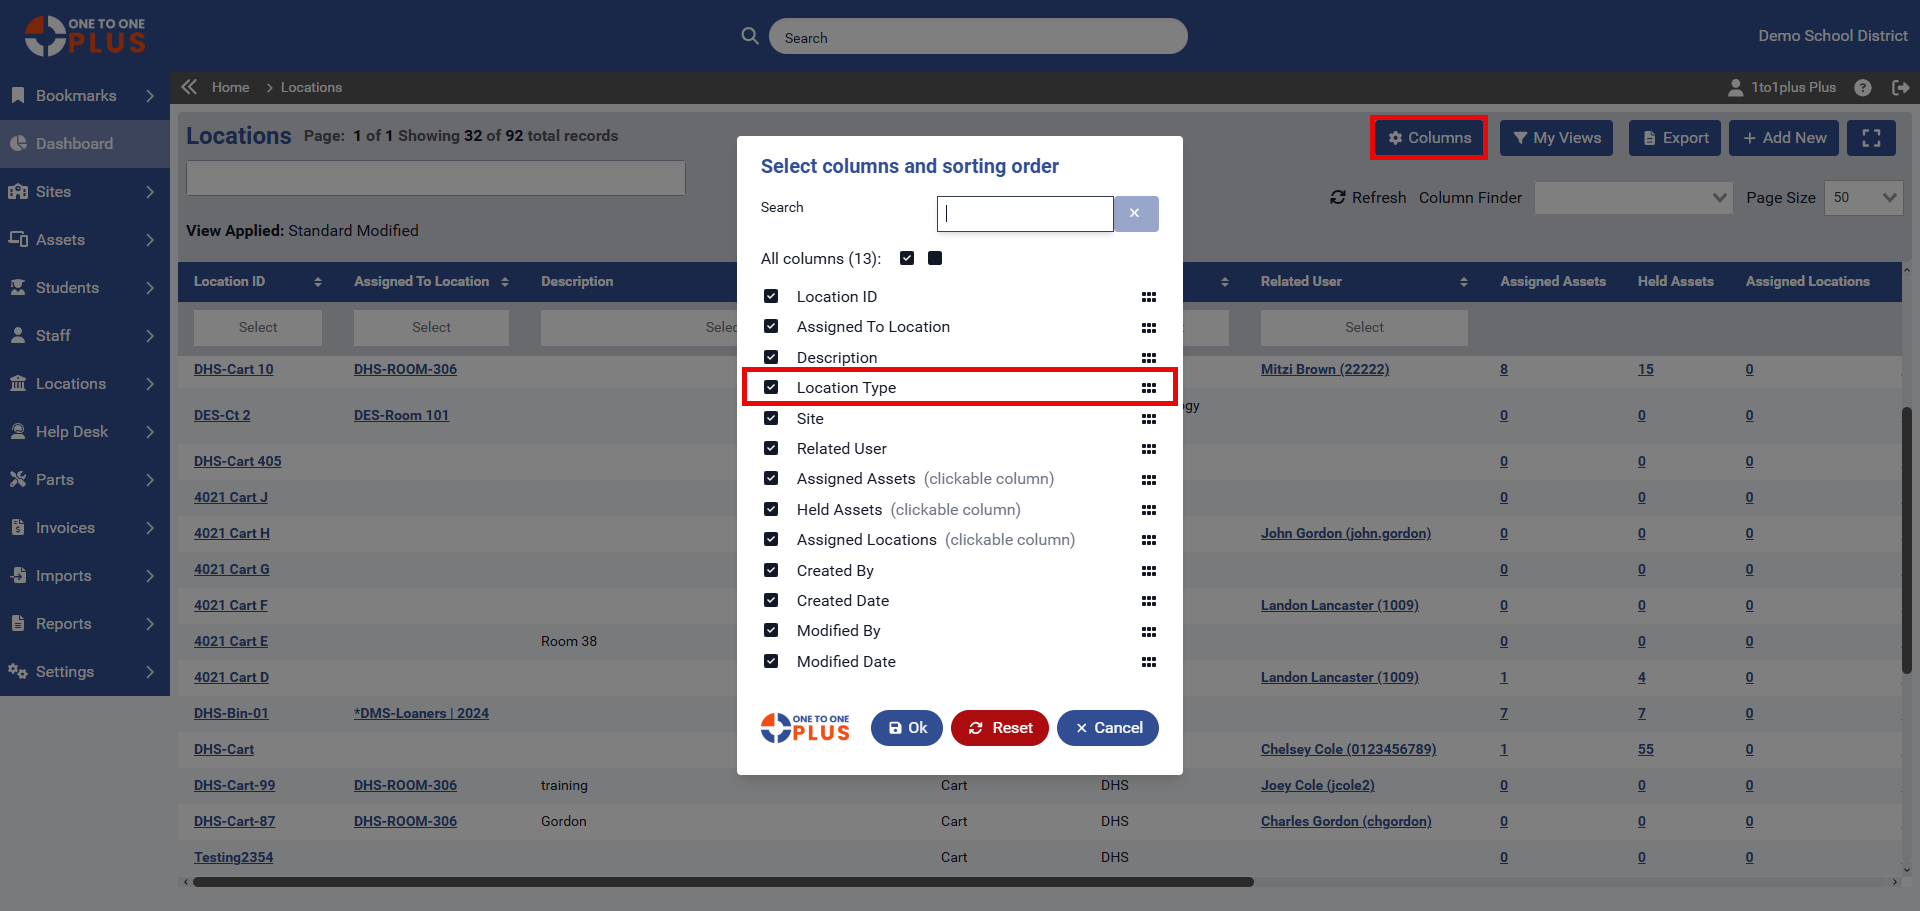
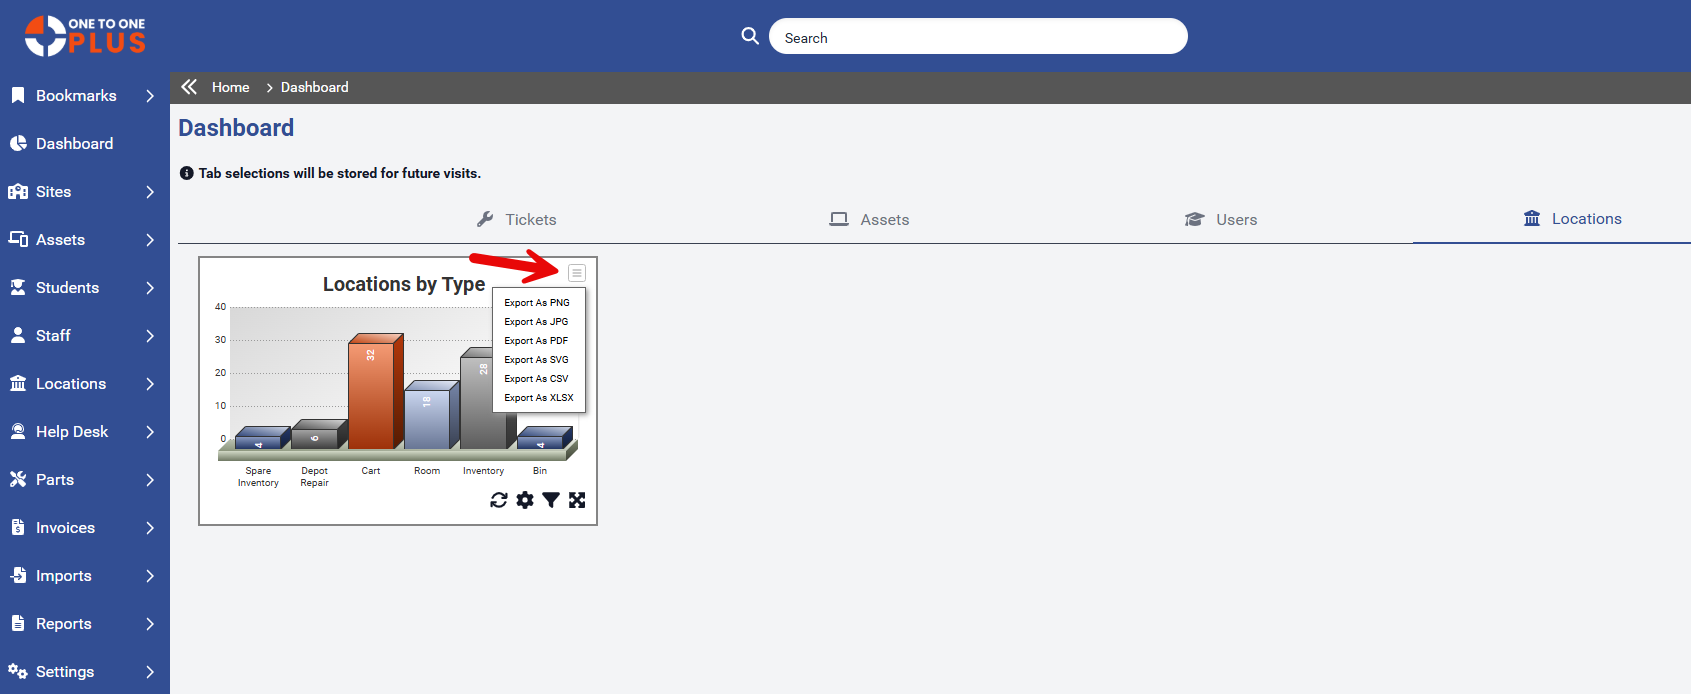
Charts can be exported in various formats by clicking the icon in the upper corner of the chart. Simply choose your preferred format, and the file will be saved to your Downloads folder.
Each chart card includes several icons for enhanced functionality. The refresh icon allows you to update a specific chart, while an auto-refresh option for the entire dashboard can be set to refresh every 10 minutes through the Settings > System section. The gear icon enables you to choose the chart type, and the filter icon lets you refine the data for that particular chart. Additionally, each chart can be expanded for a clearer, more detailed view.
Was this article helpful?